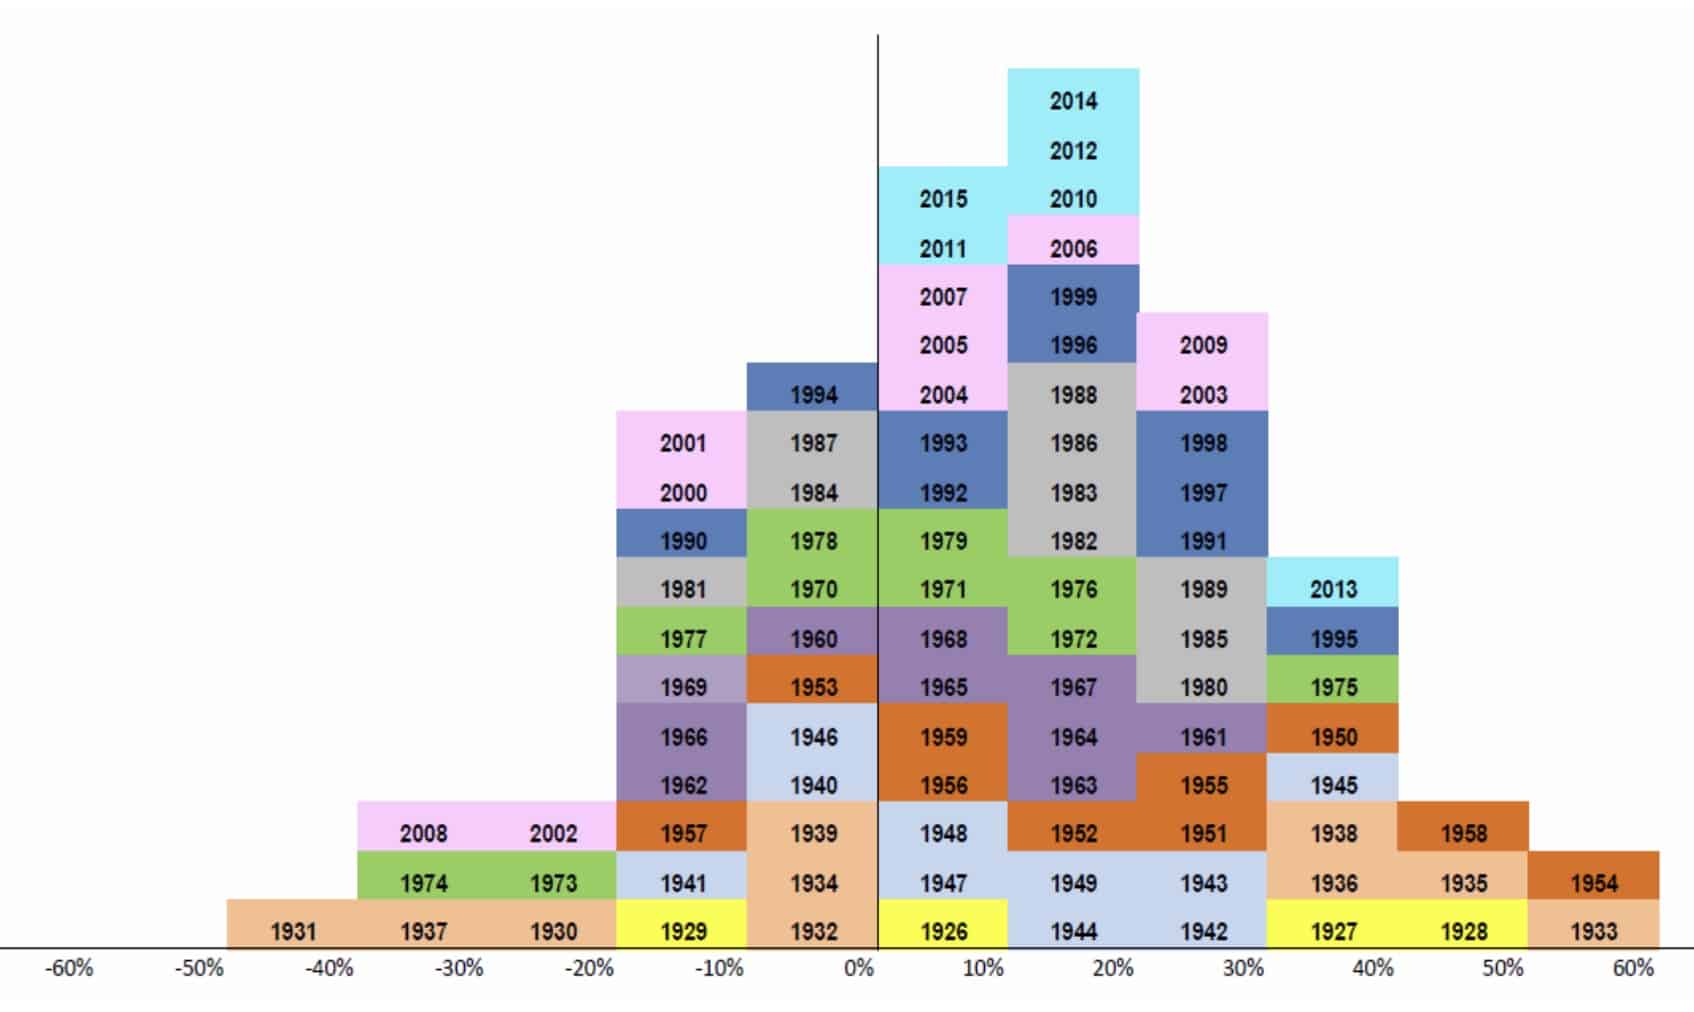
Where is the Equity Risk Premium in the Stock Market Cycle?
The fluctuations of equity prices are attributed to the competition of firms for the limited funds of investors; as a result, demand and supply achieve the equilibrium summarized in the most competitive expected rate of return adjusted for risk.
The Equity Risk Premium
Excluding the impact of market imperfections, the equity risk premium is an important concept having multiple uses:
- from the investor’s point of view, it is the expected excess return of equities over bonds
- from the corporation’s point of view, it figures into the cost of equity capital and consequently into the WACC
- from the valuation point of view, it figures into the discount rate that is used in calculations of present value
The equity risk premium’s estimation for forecasting is in many ways problematic, although it can be achieved in various ways:
- By statistically estimating its historical value (SBBI, etc.)
- By assessing investor’s demand for risk (CAPM, APT, risk factors, etc.)
- By assessing firms’ offer for rewards in terms of earnings, dividends, or cash flows
- By considering analysts’ consensus forecasts
Demand methods are based on the equilibrium projected by aggregating the risk aversion of multiple rational investors; however, the utility function theory employed to estimate such risk aversion did not prove to effectively work. Instead, supply techniques rely on the decomposition of the equity returns in dividends, earnings, cash, and book values based models aiming at forecasting one-year expected values. Finally, the long-term view (80 years or more) of historical risk premiums provides a sort of benchmark; moreover, it shed also some light on the distributional characteristics of asset classes’ series returns and alimented academic research for tests of predictability and global portfolio existence.
Estimate the Equity Risk Premium
A pragmatic approach to understanding whether the spread between demand and supply’s expectations and risk-adjusted return are sustainable may consist of estimating historical expected returns for the assets of demand models and employ a capital-weighted sum to match with the supply from capital markets. Furthermore, the impact of the real economy is included by considering the capital markets as a fixed fraction of the economy and assuming a constant growth rate for capital markets and GDP.
For instance, various risk factors models can yield an estimate for the constituent asset classes of capital markets as follows:
- Stocks: 8%
- Bonds: 1.6%
- Cash: 0%
- Real Estate: 5%
- Capital weighted sum: 8% x 20% + 1.6% x 16% + 0% x 5% + 5% x 61% = 4.9%
- Real forecast for GDP growth: 2%
- Net New Issuances (IPO, bankruptcies, etc): 1.9%
- Income Return from Capital Markets: 2% – 1.9% = 0.1%
- Real Total Return from Capital Markets: 4.9% + 0.1% = 5%
However, supply models provide a higher figure of 7%. For instance, an earnings model may decompose equity returns as follows:
- Income Return
- Dividends: 1%
- Real Capital Gain:
- Growth in P/E: 1%
- Growth in Real EPS: 5% – 1% = 4%
- EPS: 5%
- Inflation: 1%
- Inflation: 1% (because of the liquidity risk premia)
- Projected Equity Return: 1% + 1% + 4% + 1% = 7%
Is it such 2% spread sustainable in the equity risk premium? Is it completely determined by expectations? With respect to risk, return, or both?
- High speed of change in corporate earnings causes upward pressure on common stock prices; surprise differences from consensus earnings forecast may augment such effect. However, earnings usually change with the economic cycle since few firms’ earnings are counter-cyclical. Thus, supply may anticipate higher returns or may lag in adjusting because of residual firm’s necessities for capital due to the scarcity of liquidity.
- From a macro perspective, the Fed monetary policy affects common stock prices; for instance, the Fed expands the money supply decreasing interest rates whenever a slowing economic activity is accompanied by high unemployment and zero economic growth. As a result, the rate of return required to discount the future value of expected earnings decreases because its riskless component decreases; in turn, stock prices increase determining higher real capital gain. Up to three rate cuts are considered positive for markets. The nominal interest rate set by the Fed is constituted by the real interest rate and the purchasing power risk premium as it can be observed in the yield curve in terms of investor compensation for expected inflation forces on higher longer-term yields. Specifically, it is the difference between the inflation-indexed U.S. Treasury bond yield and the traditional (not inflation-indexed) bond yield of the same maturity; note that a liquidity premium ranging from 0.7 to 1.38 may affect bond markets during scarce liquidity and financial turmoil).
- The effect of monetary policy should be assessed considering the most desirable import-export position for the country. Finally, increasing money supply when the economy is approaching a historical low leads to a higher valuation, whereas at a historical high leads to heightened inflation expectations, higher interest rates and lower valuations. Thus, inflation is crucial to valuations: costs inflation is determined by labor, raw materials, and currency exchange whereas it is offset by productivity and profit margins.
Up to three rate cuts, the low to zero inflation, the president cycle and elections, the low commodities and depreciating currency may balance the negative effect of an expanding trade balance, a mixed corporate earnings season, decreasing productivity and margins to the extent the real economy appears to be in very good shape and consumers’ disposable income is free from debt burden to preserve sales financed by credit. In conclusion, it can be expected that in the short term the supply will move toward the demand until the real economy will turn its engine on.
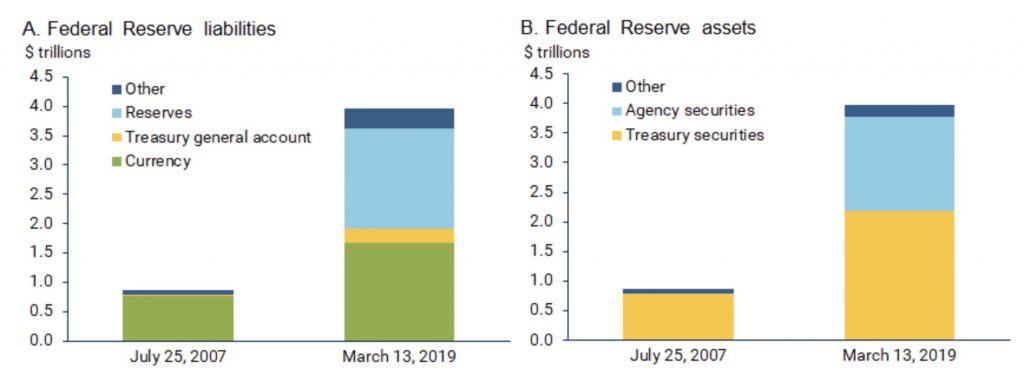
The FED Balance Sheet
According to Andrew Foerster and Sylvain Leduc, “The size of the Fed’s balance sheet will not return to its pre-crisis level. One reason is that the Fed recently decided to conduct monetary policy in a regime of ample reserves, which necessitates a larger balance sheet. This regime has financial stability benefits and minimizes the uncertainty about the Fed’s control over the stance of monetary policy. However, even without this change in operating procedures, the Fed could not shrink its balance sheet to its pre-crisis level. This is a good development since it reflects an increase in the demand for currency, a liability on the Fed’s balance sheet, driven by the soon-to-be longest expansion in U.S. history.”
A scarcity of short-term liquidity can increase volatility and drain markets?
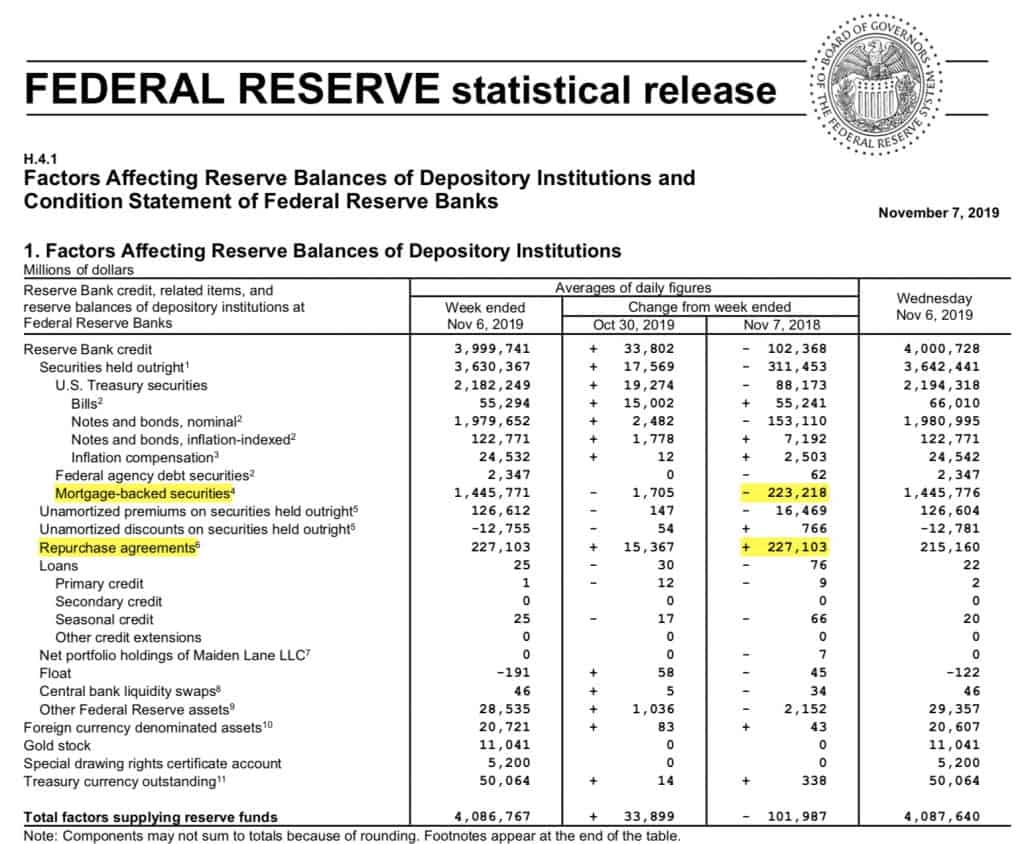
Repo and reverse repo operations were used prior to the financial crisis to adjust the supply of reserve balances and keep the federal funds rate around the target level established by the FOMC. At that time, repo operations were typically conducted daily to fine-tune the supply of reserves in the system. Indeed, Repo transactions temporarily increase the quantity of reserve balances in the banking system; instead, Reverse repo transactions temporarily reduce the quantity of reserve balances in the banking system.
The repo markets serve as a short-term channel for the transmission of money from banks to the economy through the financial market’s operating systems. Whenever funds become trapped or unavailable overnight (i.e. during inter-banks activity), the consequences of such breakdowns can range from unmatched financing to firms and consumers to financial crises such as the one that engulfed Wall Street in 2008 when overnight lending dried up between Wall Street institutions.
In mid-September 2019, cash available to banks for their short-term funding needs experienced an unexpected scarcity with interest rates in U.S. money markets climbing up to 10% for some overnight loans. The exact cause of the squeeze is still debated, but practitioners advanced a few explanations:
- corporations had to withdraw funds from money market accounts to pay for quarterly tax bills
- banks and investors who bought the last issuance of U.S. Treasuries required the settlement
- Finally, the reserves that banks park with the Fed used for overnight trading are at their lowest since 2011 thanks to the central bank’s collection of bonds
Specifically, while currency in circulation has increased, bank reserves have initially fallen because of post-crisis rules such as Dodd-Frank and Basel III determining a subsequent reconstitution to match capital requirements. Thus, the available cash they can use has decreased; moreover, the same capital constraints resulted in less profitable short-term money markets. As a result, because the Fed has historically refused the idea that its balance-sheet unwind left bank reserves in short supply, the Fed has provided a temporary fix by increasing its overnight and term repo transactions to boost short-term liquidity.
References
Goetzmann, W. N., Ibbotson, R. G. (2006). The Equity Risk Premium: Essays and Explorations
Bolten, S. W. (2000). Stock Market Cycles. A Practical Explanation
https://www.federalreserve.gov/monetarypolicy/bst_fedsbalancesheet.htm
Foerster, A., Leduc, S. (2019). Why Is the Fed’s Balance Sheet Still So Big? Retrieved from https://www.frbsf.org/economic-research/publications/economic-letter/2019/june/why-is-fed-balance-sheet-still-so-big/
Páueger, C. E., Viceira, L. M. (2010). An Empirical Decomposition of Risk and Liquidity in Nominal and Inflation-Indexed Government Bonds