The Recovery Shape is W, hopefully…
Many shapes for different economic recessions and hopes. A V-shaped starts off with a sharp decline, followed by a strong recovery. A U-shaped starts off with a more gradual drop, once hits bottom it stays there for some time prior to bouncing back. An L-shaped recession, the worst one, starts with a sharp decline in economic activity followed by a very slow recovery period. A W-shaped has GDP, employment, industrial output sharply declining and rising for two times in a row…
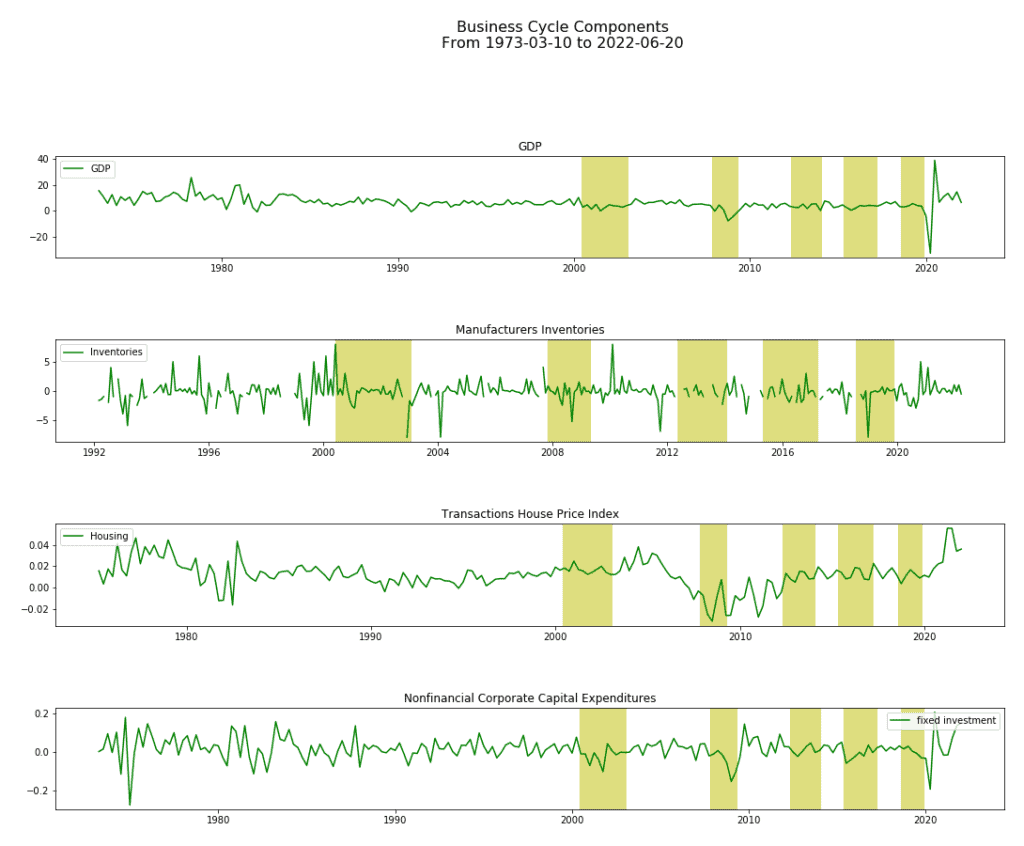
From the Recovery of 2021 to the pains of 2022 and 2023
According to the Board of Governors of the Fed, manufacturing index advanced 4.8 percent over the past 12 months but was negative in the last month. Among durables, the largest drops were in wood products and machinery. Among nondurables, an increase in petroleum and coal products outweighed decreases in food, beverage, tobacco, paper/printing.
Mining output has advanced 9.0 percent over the past 12 months. Electric utilities gained 1.9 percent while gas utilities stepped back 4.5 percent.
Capacity utilization for manufacturing edged down in May to 79.1 percent, 1.0 percentage point above its long-run average. The operating rate for mining was 81.5 percent (4.4 percentage points below its long-run average), while the operating rate for utilities was 76.4 percent (8.4 percentage points below its long-run average).
The New York Fed DSGE Model Forecast is more pessimistic, projecting inflation to remain elevated in 2022 at 3.8 percent and to decline to 2.5 and 2.1 percent in 2023 and 2024, respectively. According to the model, the probability of a soft landing is low whereas the chances of a hard landing (i.e., at least one quarter in the next ten with GDP growth under -1 percent) are about 80 percent. The pessimistic outlook reflects the cost-push shocks of 2021 and the tighter monetary policy in 2022 and 2023 resulting in a drag on real activity over the next few quarters. The Underlying Inflation Gauge (UIG) confirms such considerations.
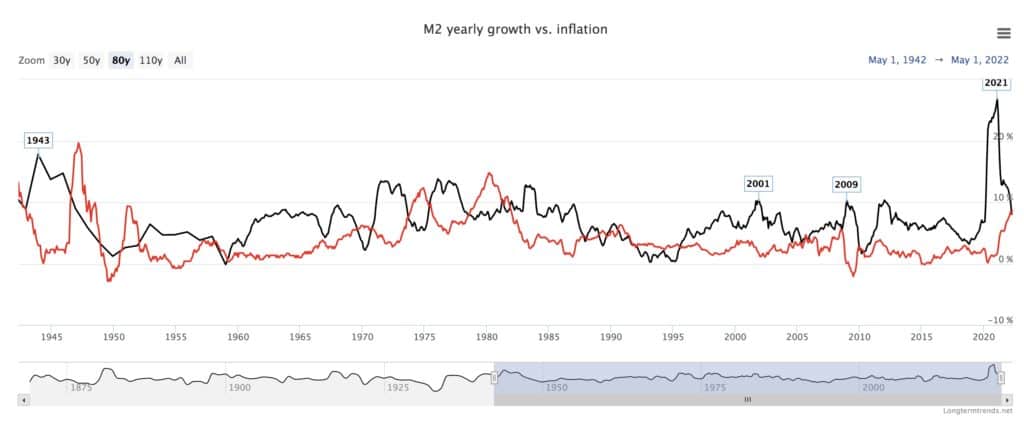
The M2 Money Supply or Money Stock is a measure for the amount of currency in circulation (physical cash, checkable deposits, saving bank accounts, etc.). M2 has grown along with the economy and the Federal Debt to GDP during wars and recessions; indeed, money supply growth and inflation are inexorably linked.
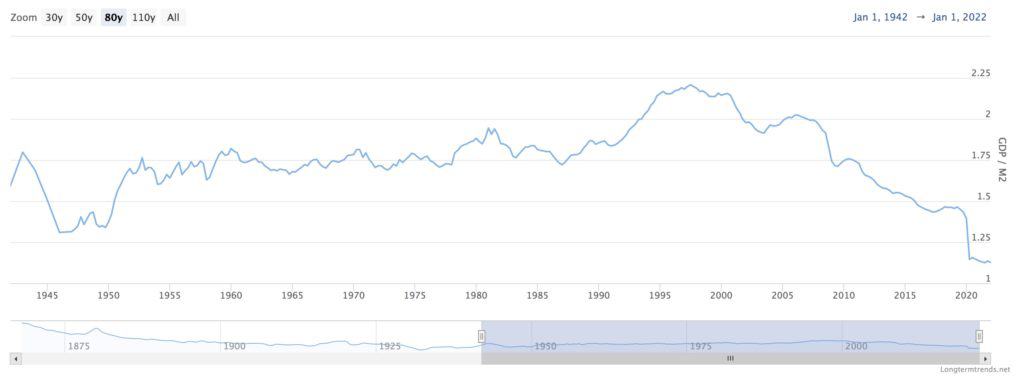
The velocity of money is a measurement of the rate at which money is exchanged in an economy. High money velocity is usually associated with a healthy, expanding economy. Low money velocity is usually associated with recessions and contractions. According to the Quantity Theory of Money, inflation depends on the money supply and its velocity. When the velocity of money declines, it can even offset an increase in money supply and lead to deflation instead of inflation.
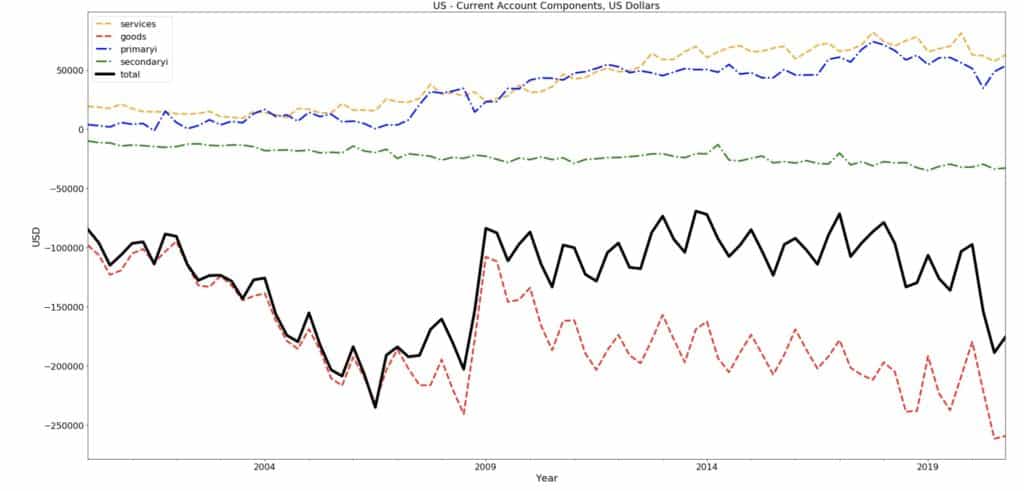
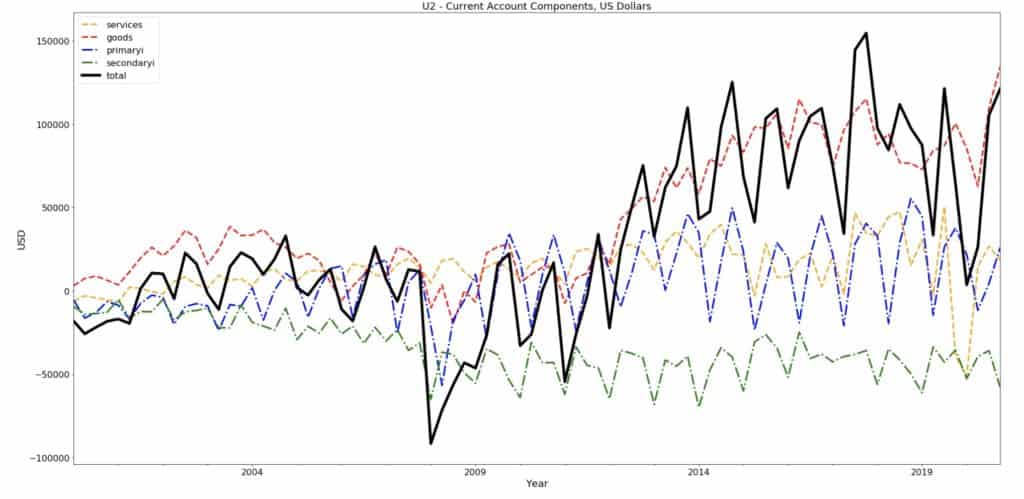
The Balance of Payments can be broken down into three important sub-components which (ideally) should sum-up to zero:
- the current account: consisting of the goods and service balance (the trade balance) and net payments (net income receipts and net international transfers). If a country’s imports exceed its exports (X-M<0) it is said to be running a trade deficit. In general, most developed nations exhibit a surplus in the services balance.
- the capital account: consisting of all the flow of non-produced and non-financial assets, such as the transfer of ownership in natural resources, intellectual property rights, franchises and leases, capital transfers of migrants, and debt forgiveness.
- the financial account: consisting of all the financial flows in and out of the economy like foreign direct investment (large and long-term financial investment within and outside the economy), portfolio investment (stocks, bonds, and bank balances). Financial investment in the US increases as the interest rate rises, whereas capital investment decreases since the cost of amortising the loan to purchase the asset increases.
Below the same chart as above for the Euro zone:
References.
Industrial Production and Capacity Utilization – G.17
https://www.federalreserve.gov/releases/g17/current/default.htm
The New York Fed DSGE Model Forecast—June 2022
Underlying Inflation Gauge (UIG)
https://www.newyorkfed.org/research/policy/underlying-inflation-gauge