Market Insights and Property Investment
The aim of this short analysis is to provide insights on the Restaurants and Bars sub-sector of the retail sector in the property market. Given the difficulty to find data at local level I made the main considerations at the national level and I integrated, assuming that some proportion exists, with local data. This kind of analysis can be extended and tailored to different sectors but the foundamental concepts always apply.
1. Classification.
Restaurants and Bars are considered to be convenience purchases, it is possible to identify two main types of restaurants: full service (where customers are served by waitress and pay after finish their meals) and limited service (where customers order and pay before eating) [ULI].
2. Trends.
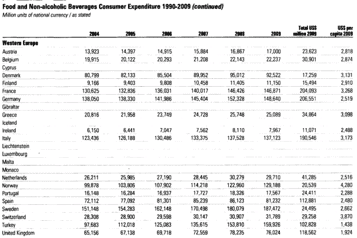
Generally when the national economy is healthy and household incomes are growing, restaurants and bar sales increase year over year. The data provided give evidence of this behavior and R&B usually can be classified as outperformers. During the last years of economical recession the pattern has not changed substantially showing a smaller, but persistent, growth [ULI].
3. Trade Area.
Given the small size of the restaurant we can identify the city of Vercelli as the primary area and the provincial suburbs of Vercelli, Biella and Novara as the secondary area. The property is situated near the historical city center and in a zone perceived as safe. Parking facilities, offices and other commercial shops are located closely [ULI].
4. Demand Demographics.
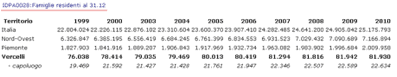
The economic conditions of the primary area are slightly above the average of the national economy, showing an increase in the number of households (we assume households=resident families) in the last 10 years. We can also suppose a slow recovery from the economical downturn.
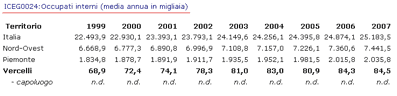
Employment in the primary area was still a positive figure until 2007, suggesting a positive forecast for sales.
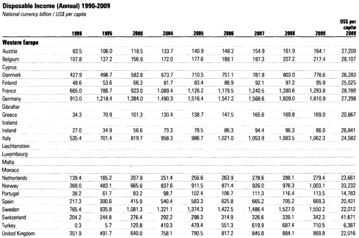
Household, family and per capita income are growing with an increase in the percentage of income available after taxes to spend on consumer goods.
The recent global economical downturn can just estimated, reducing the figures up to 20%.
Other sources of patronage, apart from the resident population, could be tourists (mainly attracted by food and wine tours since Vercelli is a renomated center of excellence in the production of rice) and college students (the local university attracts students from trade area 2) can represent a small but increasing demand driver.
Generally speaking the expenditure potential, based on household incomes and lifestyles, give an interesting insight in the R&B retail sector showing a consistent increase in the last years. This conclusion can be desumed by the increased time spent at work, reducing thus the amount of food consumed at home [ULI], [ISTAT],[SEAT],[DATAM],[LING],[WHEAT].
5. Supply of Similar Services.
In trade areas 1 and 2 there is a substantial number of restaurants mainly segmented by service, choice and price. For the purposes of our analysis we just report the competitors in the nearby area of Vercelli and comparing the figures to the national average [ULI],[SEAT],[BAUM].
| Area | Hotel & Restaurant | Pizza Restaurant | Typical Restaurant | Bar & Cafe |
| Vercelli | 15 | 14 | 12 | 6 |
| Italy | 8003 | 12882 | 16090 | 3545 |
| (IT) Stores/person | 7457 | 4633 | 3709 | 16836 |
| (VC) Stores/person | 3077 | 3297 | 3847 | 7694 |
6. Rent Estimate.
Since few comparables are available in the area we will estimate the rent using the profits method [BAUM]. The data above suggests a low level of competition and a good environment for trade. We assume an inverse correlation with summer months (60 days), thus this estimate should be defined conservative and with the aim of defining the minimum rent for a similar activity.
Monday – Thursday 30 covers x 1 guest x E. 8,5 x 200 days E. 51.000
Fridays 45 covers x 2 guests x E. 15 x 51 days E. 68.850
Weekends and holidays 45 covers x 2,5 guest x E. 22 x 74 days E. 183.150
Total E. 303.000
Gross Profit (50%) E. 151.500
Operating Costs (15%) E. 45.450
Wage Costs (15%) E. 45.450
Tenant’s Capital at 8% E. 4.000
Total E. 94.900
FMOP E. 56.600
Estimated Rent (50%): E. 28.300, say E. 28.000
7. Risk Analysis.
The risk premium for property investments is in practice assumed to be stable and constant at 2%. In reality, however, the risk premium varies over time as a result of market-specific, cyclical and exogenous factors. This particular property has been leased to a tenant active in the Restaurants & Bars sub-sector of retail; the company is family managed and well capitalized with respect to the national average. We recall here that R&B is usually outperformer in the retail sector. Given the low expenses, the ease of management of the tenant and the slowly recovering economy of the city we can assign, as a qualitative risk estimate, a below average risk. Considerations relative to economic shocks, inflation and occupation are outside the scope of this short analysis, we will just assume a positive but cautious outlook to the future, and we start from a 2,5% risk premium for the retail sector.
We now evaluate the four components of the risk associated with the cash flows from the property in object:
· The tenant risk class: company is well capitalized but small -> +0,4%
· The lease risk class: slightly below average, upwards increases, 6+6 yrs -> +0,3%
· The building risk class: recently renovated, unusual shape -> +0,2%
· The location risk class: no planning restrictions, positive reclassification -> 0,1%
Summing up we have a real estate risk premium of 3,5% [BAUM],[ISTAT],[WOUW],[LING].
8. Premium Analysis.
The premium has taken the form of initial expenditure for the recent renovation valued E. 200.000. We assume a 3% interest, similar to estimated rent’s growth, and we recover on rent in ten years.
YP – 10 yrs – 3% 8,5
Annual Equivalent E. 23.500, say E. 23.000.
References.
Urban Land Institute, www.uli.org [ULI].
The Income Approach to Property Valuation, Baum, Mackmin, Nunnington [BAUM].
Datamonitor, 2011 European International Marketing Data [DATAM].
Seat Pagine Gialle, internet search, www.paginegialle.it [SEAT].
Istat, internet database, www.istat.it [ISTAT].
Appraisal Journal, Risk Premiums in Cap Rates of Investment Property, Van Wouwe, Berkhout, Tansens [WOUW].
Economic Risk Factors and Commercial Real Estate Returns, Ling, Naranjo [LING].
Urban Economics and Real Estate Markets, Di Pasquale, Wheaton [WHEAT].