Property, Credit Crunch and Investment – Part III
This short analysis is prepared to assist a private sector house builder facing the credit crunch. In the next posts we provide strategies and insights in evaluating the development scheme and improving its performances…
To analyze the development we start from the net rent, obtained from comparables, and the realized sale’s value. Given the risk premium, which for simplicity we assume to be the same for the residential and commercial part, we find a corresponding opportunity cost of 4% reflecting the tight condition of the mortgage market. Since inflation in the last 10 years averaged 2%, the 6% construction loan less inflation and opportunity cost calculate a 0% lender development premium. Thus, we can conclude that the financial costs are of difficult improvement.
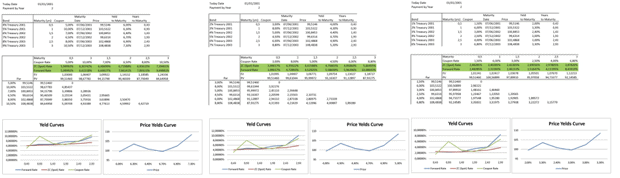
Above we have bootstrapped different yield curves to obtain estimates of the previous financial environment:
· with lower opportunity costs we find corresponding property values that may or may not represent the real market value but that in some way point to the expected value that the RE market will adjust to.
· It is when demand in the RE market is growing that lenders start to support the property cycle.
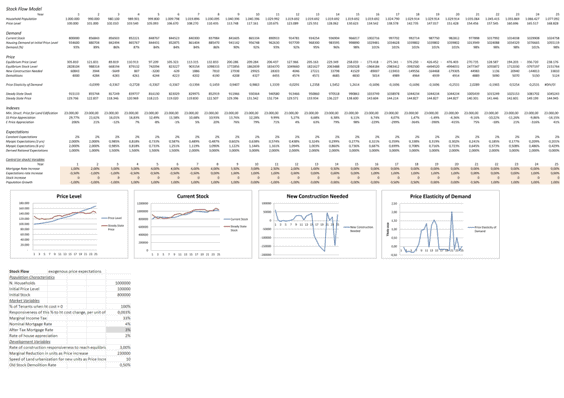
We provide a simulation of similar behavior with the stock-flow model, reported in the table above, for the purpose of qualitatively reassume the argument. We use traditional and modern methods to evaluate: RLV, SFFA, and NPV of the project to assess the initial viability of the scheme, DCF to analyze and appraise the real development.
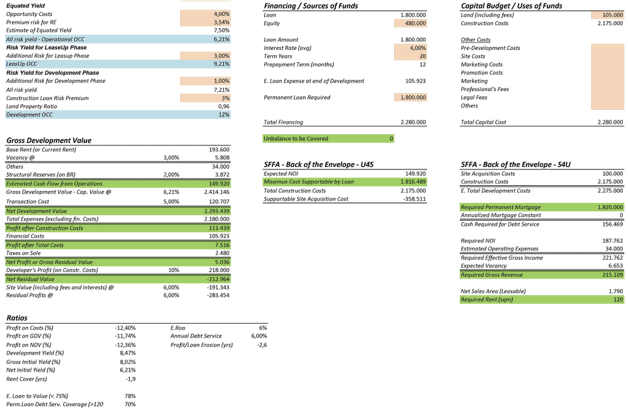
The main difference between DCF and the other models relates to the timing and extent of cash out flows since different patterns of expenditures have a strong impact on financial costs. The capitalized value is obtained with the growth explicit equated yield model, using the 6,21% all risk yield as a capitalization’s rate. The vacancy has been characterized as a fixed percentage of rent instead of including it in the all risk yield. From our initial analysis of the scheme we obtain a required rent of £ 120/sqm and a maximum supportable cost by a loan of £ 1.800.000, requiring thus an additional £ 480.000 equity to be provided by the developer and alerting us that the NOI seems to be insufficient (see appendix 1 and 2). This clearly implies that margins are reducing and requiring intervention. From the RLV we obtain a negative figure (£ -190.000) as well as solving for discounted profits (£ -280.000). Finally evaluating the NPV of the project and assigning different risk factors to each phase (development, lease-up and operational) we obtain another negative figure (£ -90.000, not including developer’s profit).
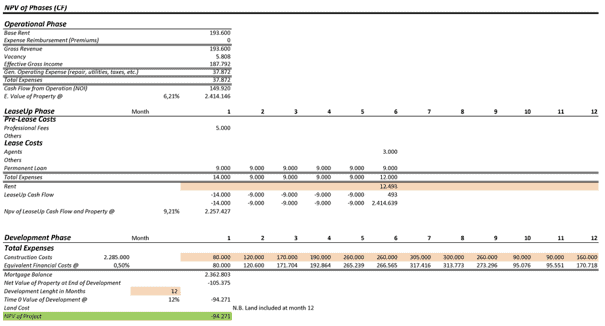
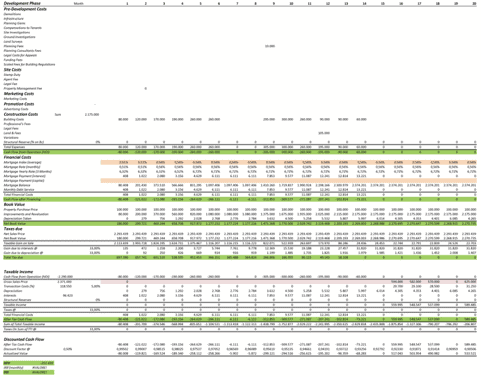
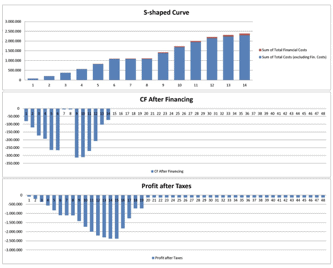
Assessing the real development using a DCF approach identifies the loss in £ -250.000 (see above). The DCF accounts for three streams of money: Cash Flow from Operations (or after construction costs), Cash Flow after Financing, and Cash Flow after Taxes. This approach has been chosen to take into consideration the impact of financial leverage, taxes and construction costs. [WU], [POOR], [SEGEL], [RED], [RICS2], [WHEAT], [RICSRP], [CPD].
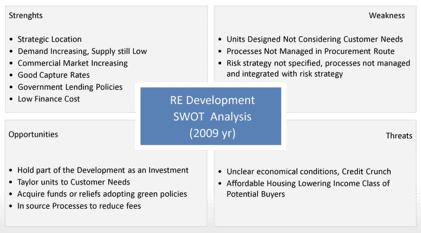
Using the SWOT analysis reported above we provide a list of suggestions that could improve the profitability of the scheme and reduce the losses of the development:
· Planning: obtain permissions from the Planning authority avoiding statement 106. This will increase the profitability of the whole complex since affordable housing “could” introduce users of different social classes and income.
· Strategy: hold the commercial part of the development as an investment. Converting the short term finance in permanent loan should cover the losses of the development (including the value of the shops), we estimate the rent sufficient to cover permanent loan’s costs.
· Value: add features highly requested by potential buyers: sanitary options, ecological materials, etc. Offering a wider project in term of sqm, kind of residential and retail units, common and recreational areas can drive up profits. Increase efficiency and total sales area (NIA); consider a loading design factor for future extension up to 15 floors.
· Sustainability: acquire funds or reliefs adopting green or energy saving policies, search for some kind of Tax relief for remediation of polluted areas, promotion of sites or job creation.
· Verticalize services: direct sale of apartments and shops, maintenance and management, sale of furniture (kitchens, living rooms, etc.) and other additional services can increase profits up to £ 8.000 per unit (5% agent’s fees + 10% of operating expenses + 20% margin on furniture, etc.).
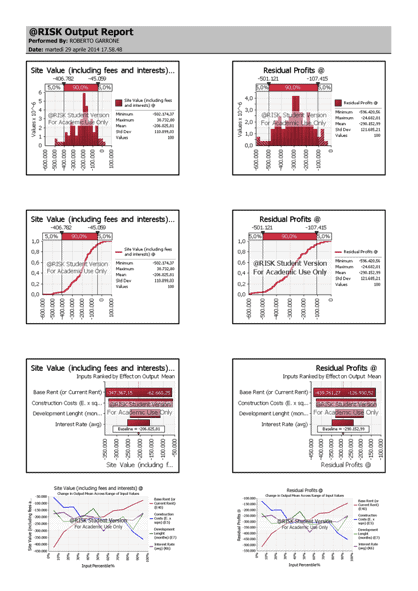
We mention some factors that may allow for development even in the case of a negative final figure: the forecasted increase in yields for residential property, a developer’s company with a structure of costs that need to be sustained, a reduction in the amount of taxes to be paid or a probable strong increase in inflation. Furthermore, we underline the importance of choosing the right use for the site and the right time to implement the development scheme.
References.
Miles, Berens, Weiss, (2001), Real Estate Development, Chapters 17,20, ULI, [RED].
Havard, (2002), Contemporary Property Development, Chapters 1,2,3,4,5,6,7, RIBA, [CPD].
Wu, Segel, (2012), Note on Financial Leverage in Real Estate, HBR, [WU].
Poorvu, (2003), Financial Analysis of Real Property Investments, HBR, [POOR].
Segel, (2013), Real Estate Finance: a Technical Note based on “Bonnie Road”, HBR, [SEGEL].
Di Pasquale, Wheaton, (1998), Urban Economics and Real Estate Markets, Chapter 10, Prentice Hall, [WHEAT].
RICS, 01/03/2008, Valuation Information Paper No. 12, 11/03/2014, www.rics.org, [RICSVIP].
RICS, -, Cash Flow Forecasting, 11/03/2014, www.rics.org, [RICS2].
RICS, -, Valuing Modern Residential Property Designed to be Rented, 21/04/2014, www.rics.org, [RICSRP].
RICS, 01/11/2013, surveys, 11/03/2014, www.rics.org, [RICS].
RICS, -, Risk Management Strategy, 11/03/2014, www.rics.org, [RICSRMS].
Savills, 01/11/2013, Research, 11/03/2014, www.savills.com, [SAV].
Bank of England, 01/11/2013, Inflation Report, 11/03/2014, www.boe.com, [BOE].
OECD, -, Statistical Profiles, 11/03/2014, www.oecd.org, [OECD].