Machine Learning and Optimization in Italian Industry: Six Testable Business Cases
The practical opportunity for Italian industry is not to install machine learning everywhere. It is to identify operational decisions that could improve when uncertain quantities are estimated more accurately and the resulting actions are evaluated under real constraints.
Italy’s industrial structure makes this distinction useful. The Italian statistical agency ISTAT reports that 16.4% of enterprises with at least 10 employees used at least one AI technology in 2025, up from 8.2% in 2024. Eurostat reports an EU-wide rate of 20.0% in 2025 for its corresponding enterprise survey. These adoption measures cover different technologies and do not imply that those firms use optimization systems successfully. Nor do they cover most microenterprises with fewer than 10 employees. The European Commission’s Italy Digital Decade report similarly identifies adoption gaps despite progress in digital infrastructure.
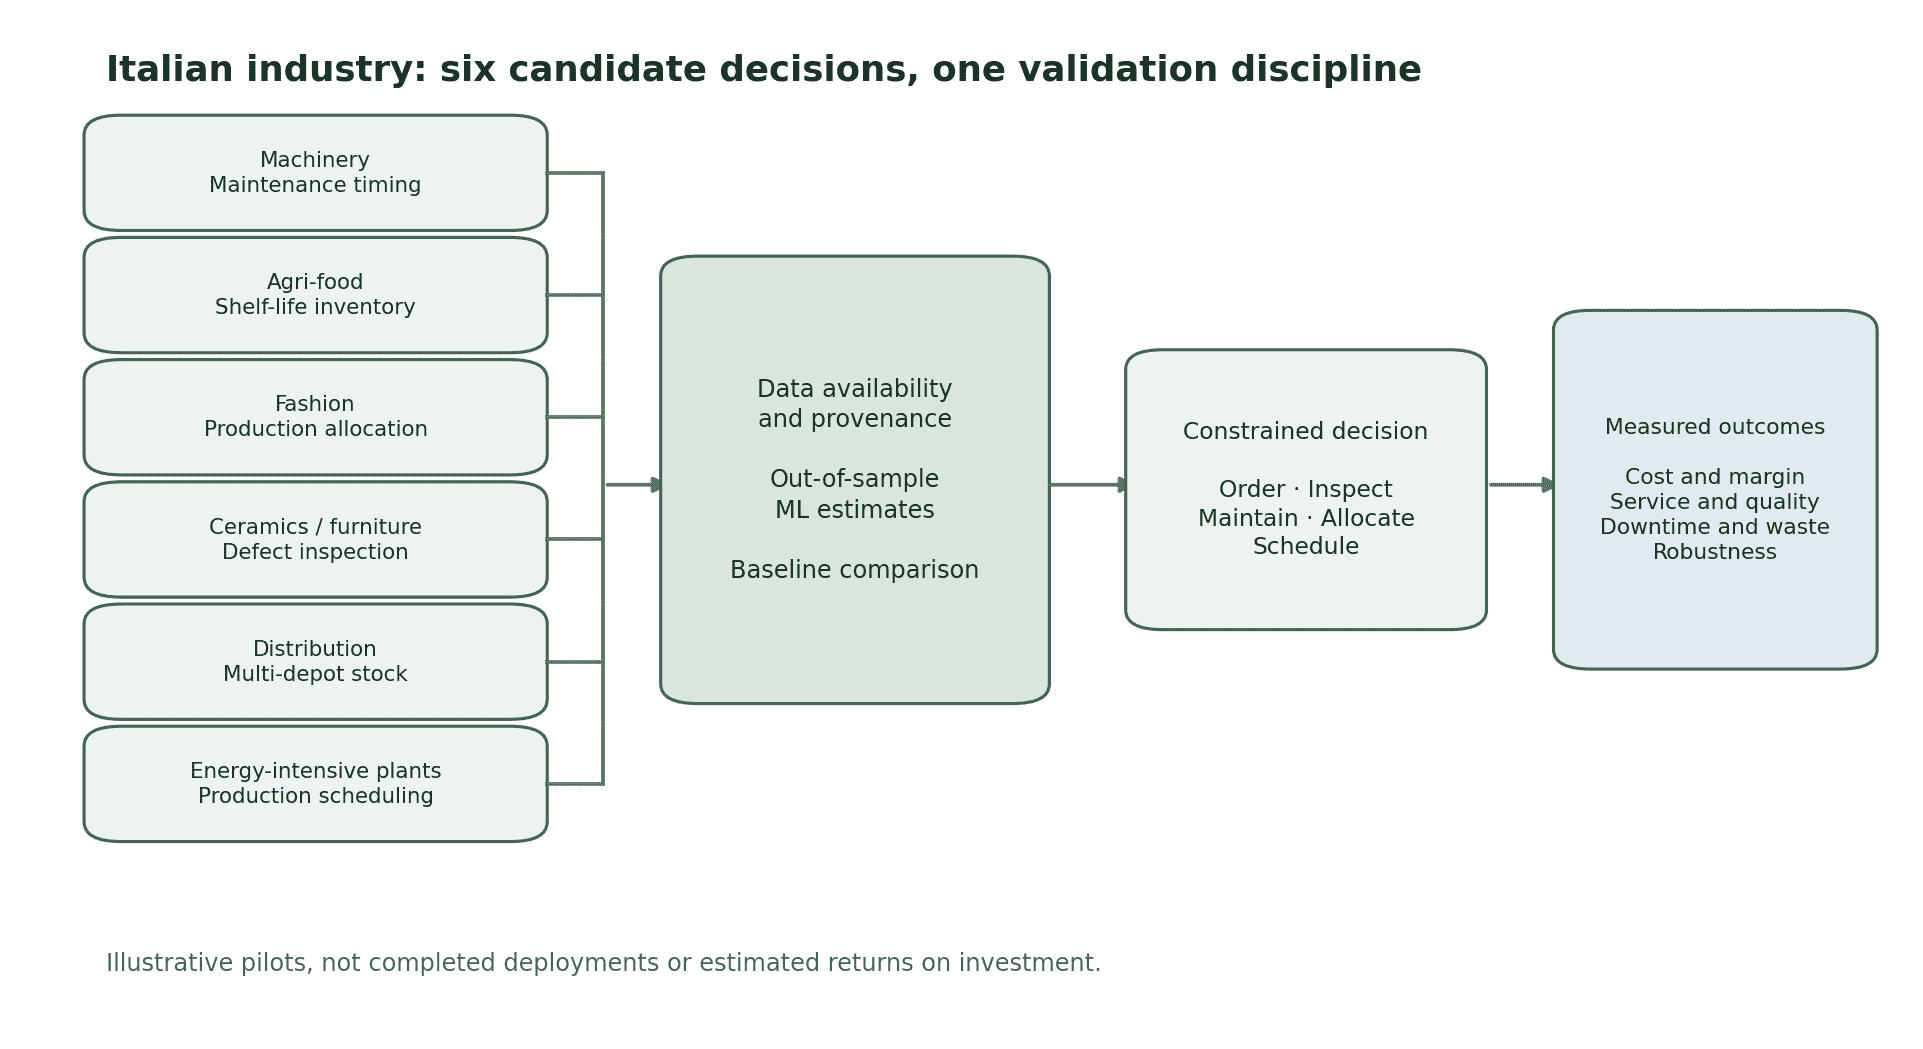
The six cases below are candidate projects, not reports of completed client engagements. Each can be investigated through a bounded pilot, provided that the relevant data and operational controls exist. This is more precise than asserting that AI adoption automatically produces a return on investment.
1. Industrial machinery and automation: maintenance timing
A machinery manufacturer or plant operator may face costly interruptions when critical motors, spindles, compressors, or robot subsystems deteriorate. A supervised model or anomaly detector can estimate condition or failure risk from vibration, temperature, current, operating cycles, and recorded service events. The optimization layer decides which equipment to inspect and when, given technician availability, spares, production windows, and the cost of an unnecessary shutdown.
- Minimum data: equipment IDs, synchronized sensor histories, operating states, maintenance records, failure definitions, and costs of downtime.
- Baseline: established preventive-maintenance schedule plus simple alarm thresholds.
- Decision metrics: unplanned downtime, interventions per true fault, missed critical failures, maintenance cost, and production loss.
- Failure conditions: changes in machine duty cycle, poor failure labels, new sensor installations, or many false alarms.
Predictive maintenance is a documented application category, rather than merely a speculative use of AI. The OECD’s 2026 review of AI in manufacturing examines predictive maintenance alongside quality inspection and supply-chain optimization. That evidence does not establish the economics of a new deployment in a particular factory.
2. Agri-food and refrigerated distribution: demand, spoilage, and replenishment
For producers and wholesalers of perishable foods, excess inventory creates waste, while insufficient stock creates lost sales and service problems. Machine learning can estimate short-horizon demand by product, customer, route, and season, incorporating holidays, weather when available at decision time, promotions, and remaining shelf life. A constrained optimizer determines orders, production batches, or transfers under freshness and cold-chain limits.
- Minimum data: transaction history, recorded waste, product shelf life, stockouts, supplier lead times, and temperature-control constraints.
- Baseline: seasonal forecasting with current replenishment rules.
- Decision metrics: kilograms wasted, gross margin after spoilage, fill rate, emergency transports, and average shelf life at sale.
- Failure conditions: treating censored sales as demand, late data, and forecasts that ignore abrupt seasonal changes.
A valid pilot tests prediction and resulting ordering decisions. A lower forecast error is insufficient if waste or lost-sales costs worsen.
3. Fashion, textiles, and footwear: uncertain demand and production allocation
Italian clothing and footwear supply chains often need to choose product quantities before knowing final market demand. At the modeling level, historical sales, order books, product attributes, store-level stock, and returns can inform demand distributions. Optimization then allocates scarce material or production capacity across sizes, styles, destinations, and delivery dates.
- Minimum data: size- and style-level orders and sales, returns, markdowns, material availability, and supplier minimum batches.
- Baseline: current merchandise planning, size curves, and allocation heuristics.
- Decision metrics: full-price sell-through, markdown losses, stockouts by size, inventory exposure, and missed delivery dates.
- Failure conditions: sparse history for new designs, changes in fashion preferences, and leakage from later markdown decisions.
The point is not to presume that a model can reliably predict a new collection. It is to compare robust policies under the range of plausible demand outcomes, including the cost of overproduction.
4. Ceramics, furniture, and components: visual inspection with production costs
A manufacturer can use computer vision to identify surface defects, dimensional anomalies, or inconsistent finishing. Yet minimizing image-classification error is not the objective on its own. A defect detector influences rework, manual inspection, scrap, and the risk that a critical defect reaches the customer. Combining the learned detector with an operational decision rule makes costs explicit.
- Minimum data: production images, traceable inspection outcomes, product types, defect definitions, camera and lighting metadata, and downstream quality complaints.
- Baseline: existing operator inspection procedure and deterministic machine-vision rules.
- Decision metrics: defect escape rate, false-reject cost, inspection time, rework, and throughput by production line.
- Failure conditions: lighting shifts, new materials or finishes, rare critical defects, and image leakage across lots.
Validation should be split by production batch and time, not only random images. A shadow-mode trial can measure disagreement with current inspections before any automatic rejection is introduced.
5. Wholesale distribution and spare parts: inventory across depots
Distributors may have enough total stock while placing it in the wrong depot. Machine learning can estimate local demand distributions or lead-time disruptions; agent-based or discrete-event simulation can represent individual orders, suppliers, shipments, and inventory states. Optimization then recommends transfer, allocation, or reorder policies under transport and warehouse constraints.
- Minimum data: item-location stock movements, historical demand, service obligations, transfers, lead times, and transport costs.
- Baseline: existing reorder points and transfer procedures.
- Decision metrics: fill rate, total inventory, inter-depot transfers, expedited freight, working capital, and cost-to-serve.
- Failure conditions: weak demand identification, inaccurate stock records, or a model trained on depleted sales rather than unmet demand.
This case connects directly to Bamboos Consulting’s research interests in inventory, distribution, and agent-based simulation. The evaluation should hold demand scenarios and costs constant when comparing policies; otherwise, differences cannot be attributed reliably to the new decision method.
6. Energy-intensive production: schedules that respect operating constraints
Plants facing fluctuating energy costs and process constraints can combine forecasts with production scheduling. Learning may estimate expected electricity demand, process duration, or defect risk at different operating settings. Optimization proposes schedules that respect deadlines, machine capacities, labor shifts, process dependencies, and energy limits.
- Minimum data: interval-level energy use, production orders, equipment states, tariffs, quality records, and feasible operating windows.
- Baseline: current production schedule and rule-based energy controls.
- Decision metrics: energy use per conforming unit, energy cost, on-time delivery, throughput, and quality losses.
- Failure conditions: incentives to shift production that inadvertently increase scrap, create bottlenecks, or violate process specifications.
Italy’s Ministry of Enterprises and Made in Italy documents the 2024–2025 Transition 5.0 initiative linking digital and energy objectives. That program’s historical existence should not be interpreted as proof of current subsidy eligibility for a proposed pilot.
How to select a pilot without manufacturing an ROI claim
The economically relevant unit is a decision, not a model. For each candidate, write down the action to be changed (reorder, inspect, maintain, allocate, schedule), the decision frequency, the constraints, and the cost of errors. Assess whether the firm has sufficient data to reproduce the historical decision context and test a credible counterfactual.
A useful comparison has three tiers: current practice, an inexpensive rule-based or statistical alternative, and an ML-informed decision method. Apply each to the same held-out operating periods or common simulation scenarios where justified. Separate training, model selection, and final evaluation. Report variation across product groups, production lines, and adverse conditions rather than publishing only a favorable average.
An illustrative net-benefit calculation is:
Incremental operating benefit = avoided losses + additional contribution margin − added operating costs − amortized implementation costs.
All terms require local estimates, and the calculation should show uncertainty. These six proposals do not provide that evidence by themselves. A credible go/no-go decision also asks whether the proposed policy can be implemented within the firm’s systems and whether operators can recognize and override incorrect recommendations.
Practical prioritization for a small or medium-sized firm
A reasonable first project has a stable repetitive decision, accessible historical records, a measurable cost of mistakes, and a baseline that can be evaluated. The most technically sophisticated task is not necessarily the best first pilot. A 30-day data audit and a bounded retrospective experiment may reveal more about feasibility than an ambitious system-wide deployment proposal, although the appropriate timeline depends on available records.
The six cases belong to different sectors, but share one validation principle: learn what is uncertain, optimize an explicit decision, and verify the operational consequence. This is the connection between machine learning and operations research that matters to industry.
Identify a Practical AI or Optimization Project
Are you considering demand forecasting, inventory optimization, production planning, predictive maintenance, or automated quality inspection?
For small and medium-sized companies, the central question is which computational approach can address a measurable operational problem with the available data, resources, and technical constraints.
Bamboos Consulting can help define a focused feasibility assessment, establish baseline performance, compare technical alternatives, and design a bounded pilot with measurable acceptance criteria.
See our Machine Learning & Optimization overview, explore relevant engineering methods in the Technical Resources library, and follow further industrial and technological analysis on Substack.
References and contextual sources
- ISTAT (2025). Enterprises and ICT — 2025. Italian enterprise ICT and AI adoption survey; enterprise scope is at least 10 employees.
- Eurostat (2026). The use of artificial intelligence (AI) technologies in the European Union. 2025 EU enterprise adoption results.
- European Commission (2025). Italy — Digital Decade Country Report.
- OECD (2026). AI in manufacturing: implementation of the EU Coordinated Plan on AI.
- Ministry of Enterprises and Made in Italy. Transition 5.0. Historical 2024–2025 framework; not a statement about new application eligibility.