

Inventory Availability, Working Capital, and the Policy Decision
Availability and capital are a joint decision
A practical framework for evaluating industrial inventory and distribution policies.
Methods and simulated comparisons are not independently verified production savings.
Why one inventory metric cannot select a policy
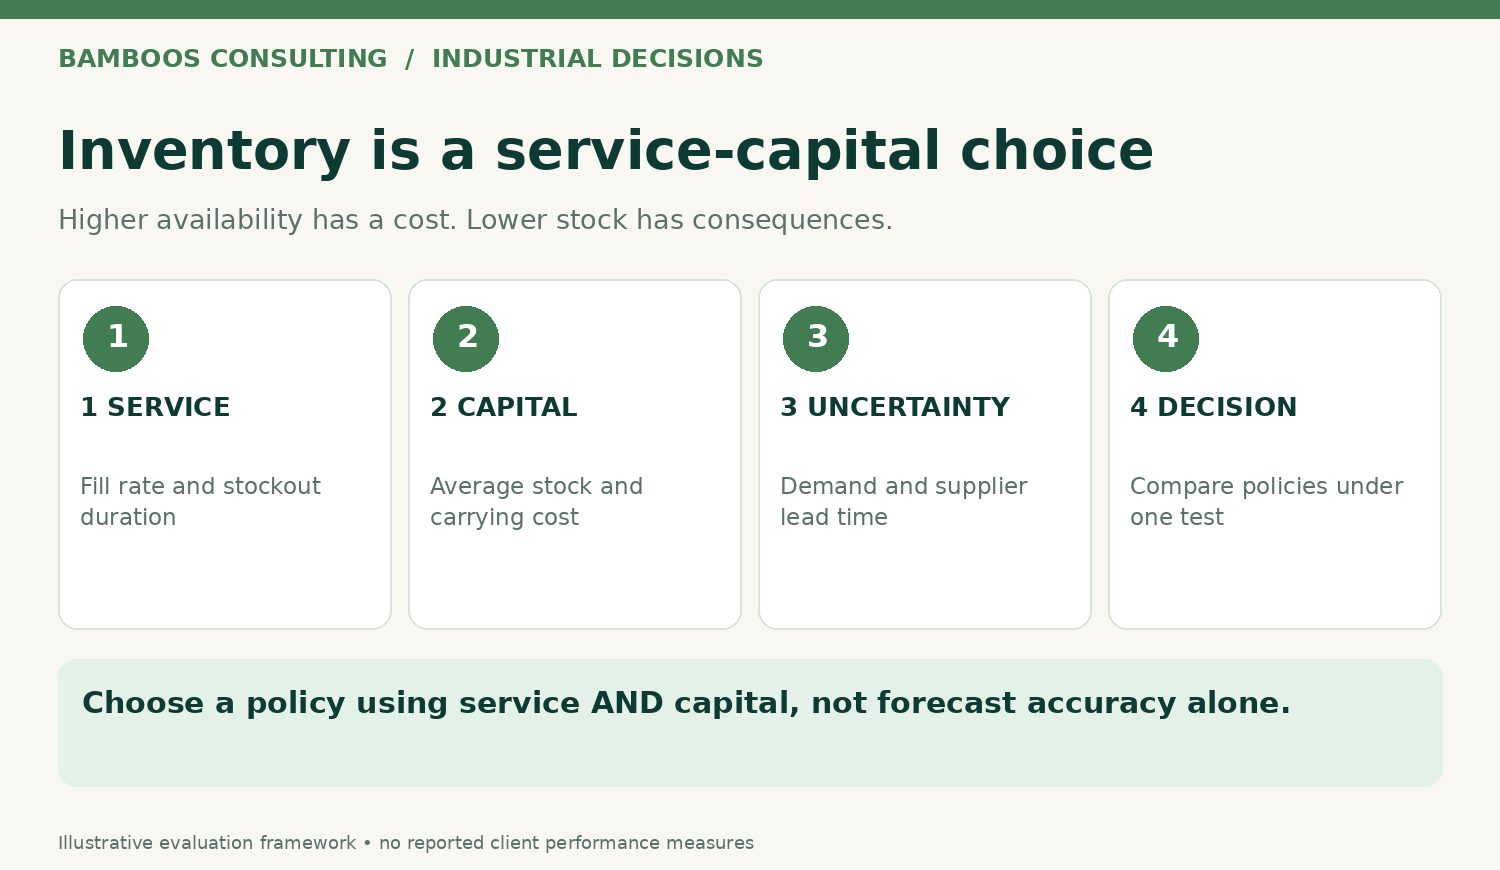
An industrial distributor can improve on-time availability by carrying more inventory, but the same decision binds cash in stock and may increase obsolescence, handling, and financing costs. A policy that reduces average inventory may do the opposite: free cash while increasing delayed orders and expediting. Neither inventory turns nor fill rate is a complete business objective. The relevant decision is which service–capital combination is acceptable under the operating constraints.
Specify the customer promise and the economic cost
Define service explicitly: order-line fill rate, complete-order availability, promised-date delivery, or maximum backorder duration. These measures differ. A 95% line fill rate is not equivalent to 95% complete-order performance when orders contain several lines. Then identify capital tied up in average stock at acquisition cost, cost of capital, warehousing, handling, expiry or obsolescence, and the commercial consequences of unavailable parts. If a stockout penalty is unknown, display service and costs separately rather than inventing a monetary loss.
Policy alternatives and the data they need

Evaluate at least the existing min–max or reorder-point rules, a modified safety-stock rule based on observed lead-time variability, and a policy using forecast or optimization outputs only when a real decision warrants it. Data should include order timing, SKU demand heterogeneity, supplier lead times and their distributions, minimum order quantities, substitutions, shelf life, returns, inventory accuracy, and service commitments. Avoid treating a forecast produced after the purchasing decision as historical information the decision-maker actually had.
Run comparative scenarios rather than announcing a forecast score
A credible test uses identical observed or sampled demand and lead-time scenarios for every policy, with a holdout period and explicit exceptions. Report mean and tail stock levels, delayed lines, fulfilled orders, procurement workload, rush freight, write-offs, and the capital consequences of each alternative. Test disruption and changing demand; compare with a simple rule and with human-managed exceptions. A better statistical forecast is useful only when the resulting policy improves the outcomes the organization values.
A historical deployment is different evidence from simulation
E-Flow Warehouse Management Software is an example of operational software with historically deployed warehouse-management functionality. Bamboos Consulting has described its use in real warehousing operations; the public product page describes inventory, receiving, picking, shipping and returns modules. This history should not be presented as proof that a new inventory policy, model, or quantum algorithm has produced measured savings. Similarly, the separate agent-based distribution-simulation article describes an experimental method rather than a validated customer improvement.
Which investment decision follows?
A decision report should show an explicit service–capital frontier: which options improve both outcomes, which exchange one for the other, and which assumptions are most influential. Identify where policy changes require systems integration, item-level tracing, inventory reconciliation, or supplier cooperation. A small pilot may be appropriate before a broader software investment, particularly when process data are incomplete.
Relevance for Northern Italian distributors and producers
Industrial spare parts, machinery components, technical distribution, and manufacturing supply chains face nonuniform demand and costly service failures. This makes inventory-policy evaluation a practical question for companies in Emilia-Romagna, Lombardia, and Piemonte. The industrial context motivates a structured test; it does not establish that companies in these regions have an active procurement requirement for external services.
For related methodological background, see Machine Learning and Optimization, distribution simulation, and AI Consulting & Computational Systems.
Discuss Inventory Policy Evaluation
Compare stock availability, cash committed, and service constraints
An initial discussion can clarify the available order, stock and supplier data, the business service commitment, and a feasible comparison of replenishment policies.
Explore Technical Resources, Machine Learning and Optimization, and Substack analysis.