
Pension investing is more a process of matching assets to liabilities, with the ultimate objective being to pay retirement income. Usually a young plan can afford greater risk because of longer time horizons. The solvency of pensions and insurers suffered as yields fell because it increased the present value of their liabilities, which were difficult to match with assets.
ANONYMOUS
We construct our benchmark portfolio using the following indexes: FTSE 100 for UK equities, RUSSELL 2000 Growth for Overseas equities, UK Debt Management Office Gilt Index for UK Gilts, NAREIT MIXED USE for Property and BoE Interest Rates for Cash. Each index is sampled monthly; since we have limited access to historical series we can use data just from April 98 to December 2008. We remember here that it should be better to use a longer period or a higher sampling rate. All returns are log returns.

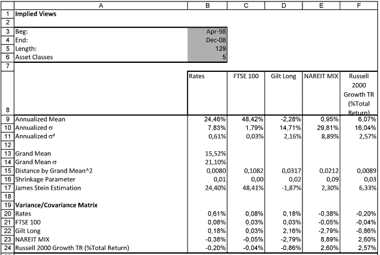
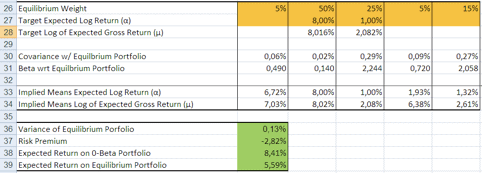
The weights for our equilibrium portfolio are assumed to be the same of the evaluated portfolio: 50% for equities, 15% for bonds, 5% for Property, 15% for overseas equities and 5% for cash. The proposed allocation, that it is assumed to be on efficient frontier, had not provided high returns and it is to be revised.
The table above reports the figures for the ten years considered, we use JS estimation to account for the effects of volatility.

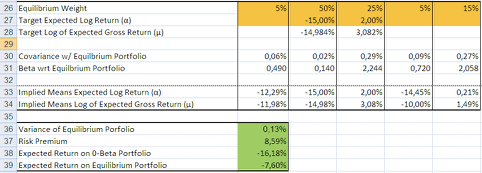
Since the portfolio is to be considered for a pension fund, we first look at the effects of a returns shock: we see a -7.6% expected return. It is interesting to look at the effects of the 5% allocation in property: looking at the covariance of property we easily infer a lower performance. Indeed the expected return decrease of 1.45%. We remember here that NAREIT indexes exhibit more volatility than transactions indexes because of its liquidity and the number of financial tools that are built on it. Using a transaction index the figures below can just improve, but historical series are not available.

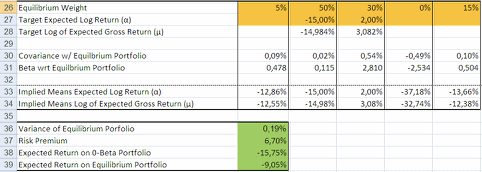
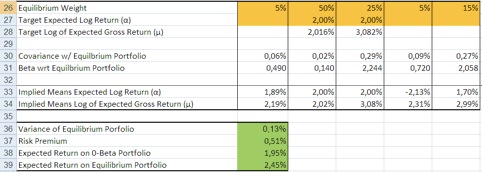
When the economy improves, or when we assume that our target expected log returns derived from the sampled means of the first table improve, we see that returns improve, resulting in a performance of 2,45% and up to 6%.
We construct the efficient frontier using the same historical series and frequency of sample:

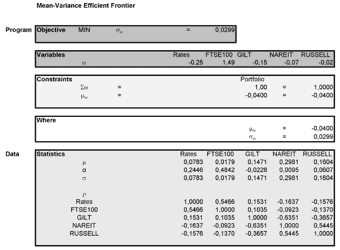
Since we do not know the utility function required by the pension fund nor the restrictions on neither the assets allocations nor the liabilities requirements we just analyze the efficient frontier and provide general suggestions [RMON],[CHOU],[PROP],[MOST].
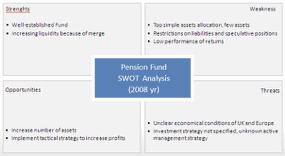
As expected to increase returns we need to take in account more risk, faced with the problem to allocate 10% more we need to make some assumptions on the future economical conditions of UK and Europe. Given the long time horizon of a pension fund it seems that it could be wise to reinforce the positions in UK stocks or UK Corporate Bonds that still trade at bargain prices. Adding an asset, like UK Corporate Bonds, can just improve the performance of the fund but we are not aware if it is a feasible option. We assume that all the liabilities of the fund are set with the initial asset allocation and we suggest to have 25% more in cash than needed to fund all the liabilities (at the margin). The new suggested asset allocation is reported in the table above, individuated by the 10% return label; changing weights on assets require just 5 mln of the 100 mln provided by the merge, and we can expect to pay 5 mln in transaction cost and losses. The rest is evenly reinvested.
Proposal.
We summarize our proposal using the reported SWOT analysis:

- Since the beneficiaries of the pension fund had already earned the right of receive the future payments we can think of the whole fund as long term bond, which performances will be mainly driven by interest rates behavior: the return is the percentage change in the ratio (assets – liabilities) / assets and the risk is the change in its variance. Optimizing this performance is part of a well planned fund strategy.
- Define an investment horizon compatible with the expected returns and the desired risk of the beneficiaries of the pension fund, matching investment horizon and expected behavior of interest rates is essential to provide the expected performance and it must be included in the fund strategy.
- Manage diversification: one option could be adding more asset classes. Since we already know that in case of economical shocks correlation tables are not reliable we base our decision on asset classes with high liquidity and anti cyclical features. Diversifying trough markets can just add complexity (for instance the need to adjust liabilities for currency hedging) and it not proved to be efficient. This will be part of the fund tactical and dynamic asset allocation.
- In source strategic services like stock picking, assets management and market analysis.
- Relate the fund strategy to its performance, not just analyze the returns. Holding-based attribution can provide valuable feedback to the fund strategy both in implemented positions and in forecasts. It has the advantage of being closely linked to the real economy [RMON],[CHOU].
References.
Rics, www.rics.org, surveys, [RICS]
Savills, www.savills.com, research, [SAV]
The Economist, www.economist.com,
03/06/13, Buttonwood, [ECO1]
20/04/12, Buttonwood, [ECO2]
03/03/12, The Economist, [ECO3]
Bank of England, Inflation Report Nov 2013, [BOE]
OECD, www.oecd.org, statistical profiles, [OECD]
Morningstar Fund Report, www.morningstar.com, [MOST]
Ubs Asset Management, www.ubs.com, Pension Fund Indicators 2013, [UBSI]
Black-Litterman, www.blacklitterman.org, The Black Litterman Model in detail, [BLTM]
Running Money: Professional Portfolio Management, Stewart, [RMON]
Global Property Investment: Strategies, Structures, Decisions, Baum and Hartzell, [GPRO]
Bonds and Money Markets: Strategy, Trading, Analysis, Moorad Choudhry, [CHOU]
Efficiency in the UK commercial property market: A long-run perspective, Devaney, Holtemoller, Schulz, [EFF]
The Role of Property in Mixed assets Portfolio, Hoesli, MacGregor, Adair, Mac Greal, [PROP]